End-to-End Cloud Data Integration & Analytics
SIMPLE. POWERFUL. SCALABLE.
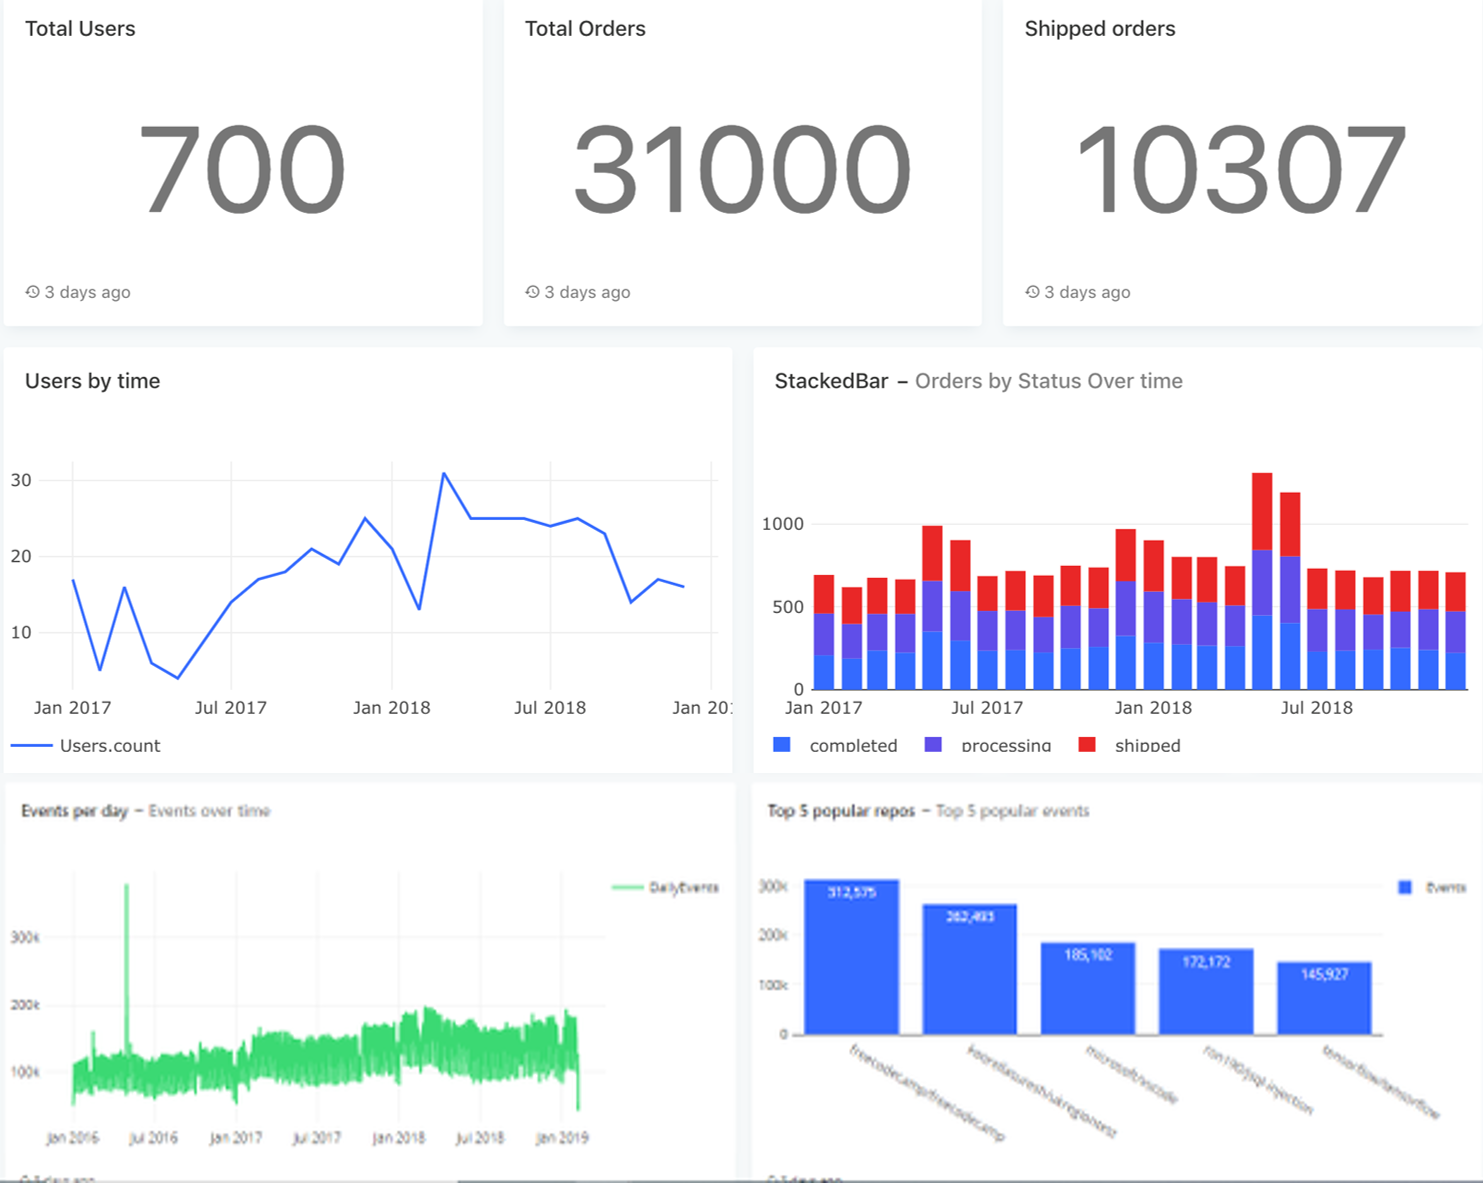
Build beautiful interactive dashboards
Connect and import data from any source, analyze data through visual reports and dashboards, and share and collaborate on reports and dashboards securely.
Live Data
Build visualizations from multiple data sources in real-time. Choose from dozens of visualization types such as pivot tables, maps, boxplots, tables, etc.
Embed and Share direct links to Dashboards and Reports
Embed powerful analytics in your SaaS products, on the manufacturing floor and office digital signage
Export Charts and Dashboards
Charts can be exported to a PNG for printing, and any table can be exported an Excel spreadsheet, or a CSV file
Real-time alerts and notifications
Get Reports alert directly into your Slack channels, and turn analytics into action. Also get alerts via email, webhooks, chatworks and other integrations.
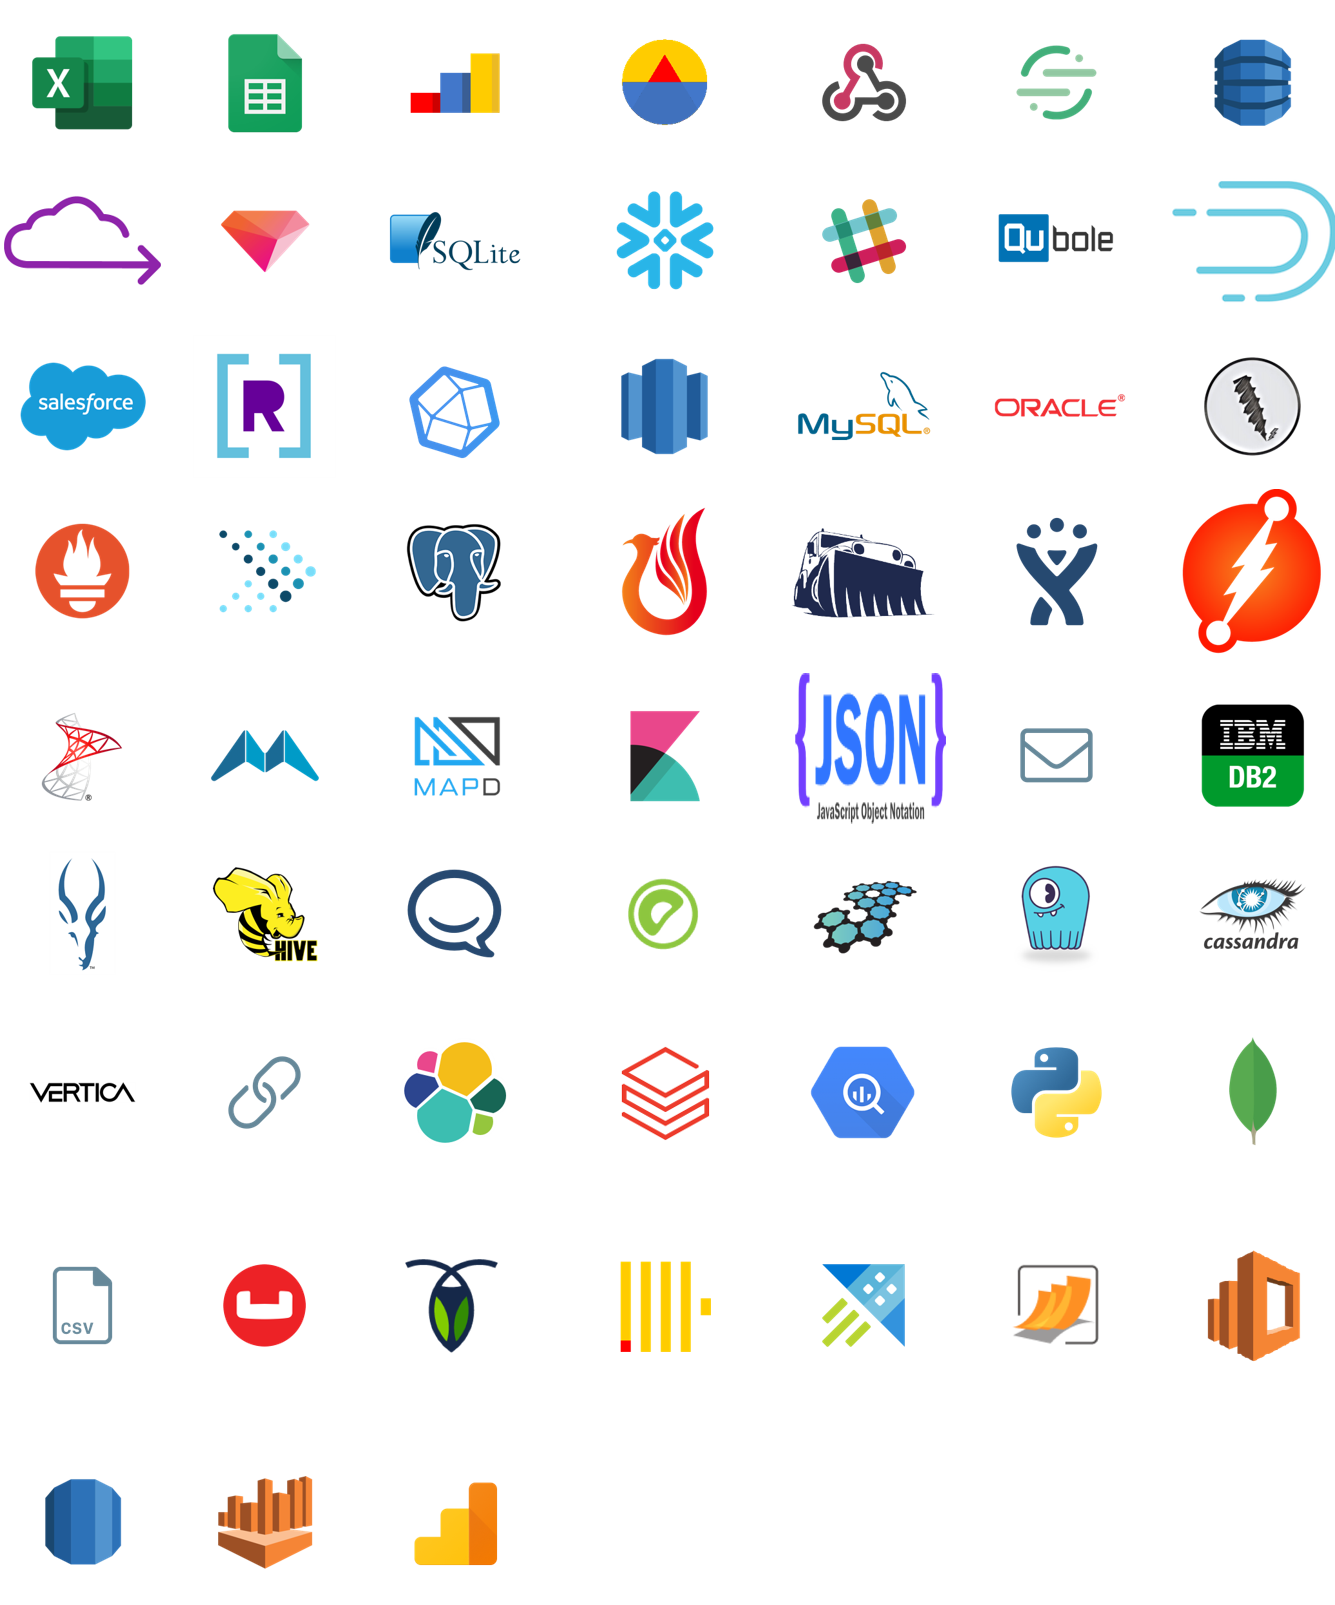
Datasources & Integrations
Connect all your data sources in one place. Easily combine, load and visualize no matter how large from cloud-based sources to spreadsheets to all types of databases.
Join Multiple Data Sources
Connect to multiple data sources and join data across these sources to create to create and build dashboards. (example: Joining Excel against a transactional database)
Flat Files
The Flat File Data Connector allows you to easily connect to your files regardless of the file type you choose (CSV, XLS, XLSX, XML)
Cloud & On-premise Databases
Connect to your data in the cloud, on-premises, or hybrid. Easily move workloads to the cloud or back to your local environment
Powerful Query Editor
Write queries in their natural syntax with live auto-complete and keyboard shortcuts. Use Query filters and pass parameters to your dashboard at query run-time
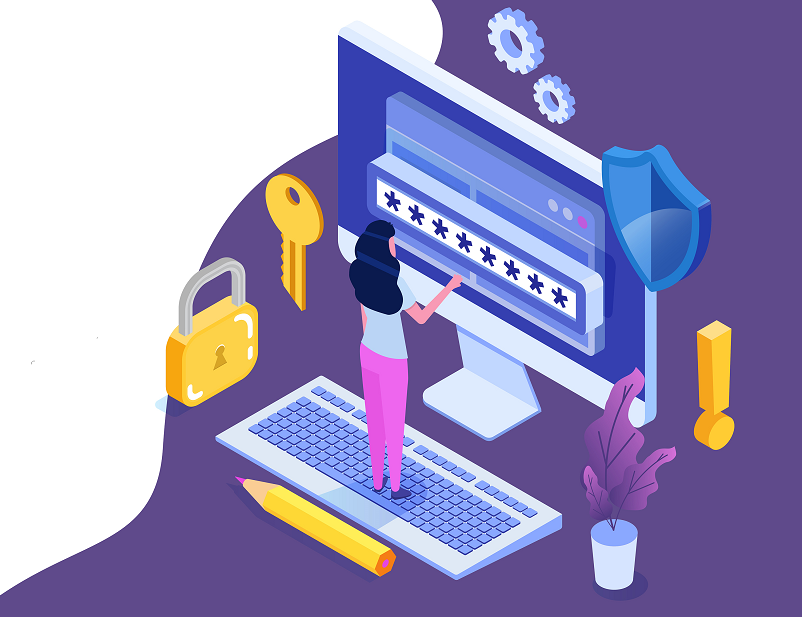
User Management & Security
TableScope allows you to manage your users, groups and permission for your organization. The Account Administrator is allowed to control the permissions, add/delete users in his/her organization. This includes creating reports/dashboards, managing users, sharing reports, managing subscription plans, etc.
- Unlimited Users
- Simple user management interface
- Role-based access control.
- SSO, SAML, LDAP Integration
- Two-factor authentication
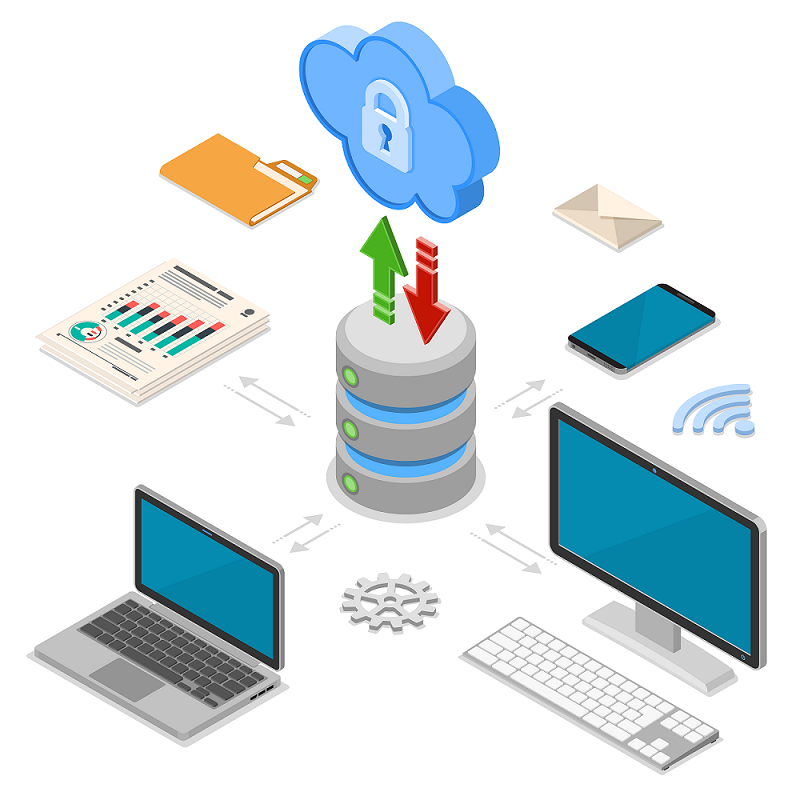
Enterprise Integration
We know you want all your data to be stored in such a way that you can retrieve it easily and swiftly. Our data virtualization platform combines data from different repositories under a single view allowing you to use it easily without the hassel of moving it into a data warehouse first.
- Connect across disparate IT ecosystems in real-time
- Integrate all applications whether in public, private or hybrid-cloud environments
- Deploy complex data models and integrations
- Create virtual data lakes
- Parse XML & JSON files directly into virtual RDBMS at run-time
- Deploy harmonious REST services in minutes